
98131
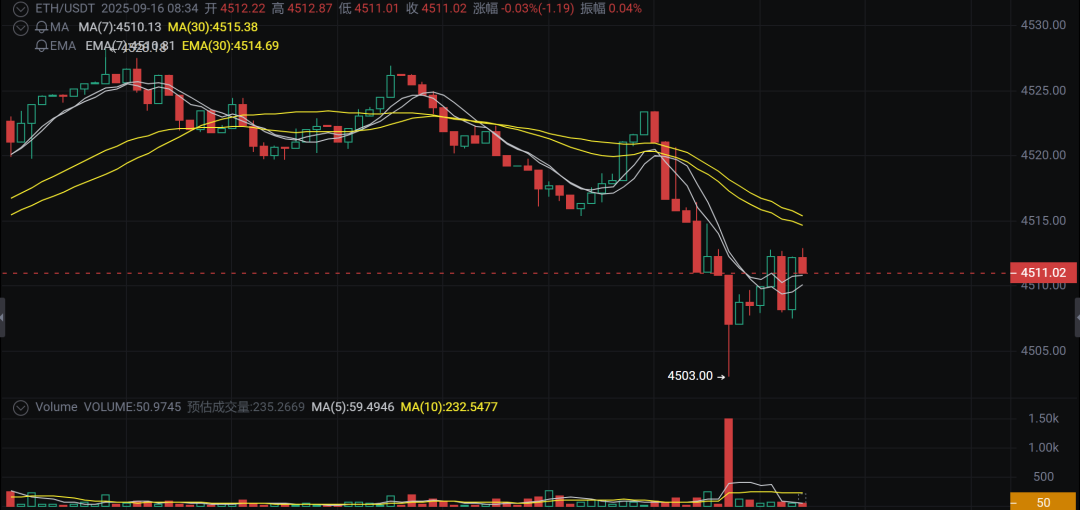 The current market ETH is in [range shock]. Technical core driver: The price fluctuates between the strong support of 4503 and the strong resistance of 4521.12, forming an obvious range-bound pattern. Impact of the external environment: Market sentiment is neutral, there is no significant pressure on the macro environment, and the news is mixed with bulls and bears. Main potential risks: The increase in trading volume accompanied by the price being lower than VWAP indicates that the market is under heavy selling pressure and there may be a risk of downward testing of support in the short term. 1. Overall analysis and judgment The ETH market is currently in a low-volatility range-bound state, with prices fluctuating repeatedly between strong support at 4503 and strong resistance at 4521.12. Technical aspects show that the market's long and short forces are temporarily balanced, but there are certain conflicting signals: on the one hand, the hammer line pattern hints at the possibility of a bullish reversal. ; On the other hand, the moving average system is arranged in a short position and the trading volume is enlarged with the price falling, indicating that the selling pressure is heavy and the price may continue to be weak in the short term. In terms of the external environment, market sentiment is neutral, macro pressure is limited, and there is no risk of major events in the short term. However, the news is mixed with bulls and bears, with institutions increasing their holdings of Bitcoin and policy support forming a positive factor. At the same time, sluggish retail investor participation and the risk of tight valuations have put certain pressure on the market. Taken together, neither the technical aspect nor the external environment provides clear trend signals, and the market is more likely to continue to fluctuate within the current range. 2. Interpretation of key evidence Technical diagnosis Market status identification: The current market is identified as "range oscillation". Key findings: The price is located between the strong support of 4503 and the strong resistance of 4521.12, forming an obvious range-bound pattern. The K-line pattern shows a bullish reversal signal from the hammer line, but the moving average system is arranged in a short position, and the trading volume is amplified along with the price decline, forming a conflict between long and short signals. The trading volume has increased significantly and the price is lower than VWAP, indicating that the market is under heavy selling pressure and the price may continue to be weak in the short term. Macroscopic and emotional diagnosis Overall environmental rating: The external environment is overall rated "neutral". core evidence: Market sentiment is neutral (Fear & Greed Index). Macroeconomic pressure is limited, and the U.S. dollar index and government bond yields have not changed significantly. The news is mixed with bulls and bears, with institutions increasing their holdings of Bitcoin and policy support forming a positive, but sluggish retail investor participation and the risk of tight valuations pose pressure. 3. Strategic suggestions and key points Based on the above analysis, we propose the following trading strategy plan, please refer to it based on your own risk preference. Strategy 1: [Sell High - Stable] Entry area: 4519.7 USDT Stop loss price: 4524.63 USDT Target area: 4505 USDT Strategy basis: Given that the current market is in a low-volatility range-bound state, and the price has formed an obvious selling pressure signal near the strong resistance of 4521.12 (the trading volume is enlarged and the price is lower than VWAP), adopting a stable strategy of selling high and shorting near the resistance level is a reasonable choice to comply with the current market structure. Strategy failure scenario: If the price breaks through 4524.63 and stabilizes, it indicates that the range-bound pattern is broken and the strategy fails. Strategy 2: [Buy Low - Aggressive] Entry area: 4503 USDT Stop loss price: 4498 USDT Target area: 4519.7 USDT Strategy basis: Given that the current market is in a low-volatility range-bound state, and 4503 is a strong support from the previous low, the price may rebound in this area. Adopting a radical strategy of buying low and going long near the support level is a reasonable choice to capture short-term rebound opportunities. Strategy failure scenario: If the price falls below 4498 and continues to decline, it indicates that the support has failed and the strategy has failed. 🛡️ Disclaimer This content is generated by AI based on multi-dimensional data sources. All content is for reference only and does not constitute any investment advice. The market is risky and investment needs to be prudent. Please make independent decisions based on the actual situation. |

|

|

|

|

|
违法和不良信息举报电话:010-6688xxxx | 举报邮箱:jubao@huoxing.com | 网上有害信息举报
xxx网络有限公司 | 粤公网安备 46902302000xxx号 | ©2021 Discuz Team. Powered by Discuz!