找回密码
 立即注册

Dogecoin (DOGE) US$0.25 is gaining momentum: moving average support + neutral RSI, the breakthrough window is to be opened

ELON 2025-10-14 22:24 38825人围观 DOGE

Dogecoin (DOGE) is currently trading at US$0.25, over the past 24 It rose slightly by 1.09% on the hour. Not only is it firmly above all major moving averages, but the RSI (relative strength index) is in the neutral zone, laying the foundation for a poten
Dogecoin (DOGE) is currently trading at $0.25, up slightly by 1.09% in the past 24 hours. Not only is it firmly above all major moving averages, but the RSI (relative strength index) is in the neutral zone, laying the foundation for a potential breakthrough in the future. DOGE is currently consolidating within a narrow range, and with the cooperation of technical aspects and market sentiment, it is waiting for the next direction signal.

Market Overview: Volume remains stable amid narrow range fluctuations


DOGE has recently fluctuated slightly in the range of $0.24-0.26. Although there has been no major unilateral trend, the price has always been higher than the three key moving averages on the 20th, 50th, and 200th - among which the 20-day moving average coincides with the current price of $0.25, providing immediate support.

Judging from the trading volume, the daily scale of US$319.4 million has not shrunk due to sideways trading, which shows that both institutional and retail investors' attention and participation in DOGE remain stable and have not left the market due to short-term consolidation.


Technical analysis: Neutral bias, bullish momentum emerging


The technical aspect of DOGE shows "neutral but positive" characteristics:
  • RSI indicator: The current reading is 50.4, which is in an absolutely neutral range. It is neither overbought (to avoid correction pressure) nor oversold (no need to worry about excessive decline), leaving room for subsequent two-way fluctuations. As long as there is a market catalyst, the direction can be quickly switched.
  • MACD indicator: A bullish crossover has been formed, and the histogram reading is 0.0003. Although the value is not large, it indicates that early bullish momentum is quietly accumulating rather than continuing to weaken.
  • Moving average structure: DOGE's current price is 1.1% higher than the 20-day moving average, 3.1% higher than the 50-day moving average, and 20.9% higher than the 200-day moving average. This "above all moving average" trend shows that even if the short-term sideways trend occurs, the overall upward trend has not been destroyed. The 20-day moving average near $0.25 is the key support for short-term bullishness.

Key price levels: $0.27 resistance and $0.22 support determine direction
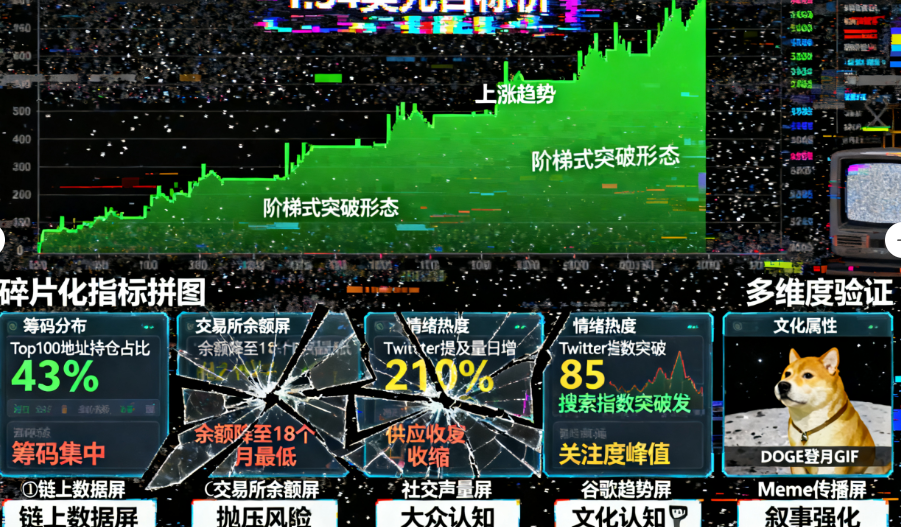


The current focus of DOGE’s long-short game is on several key price levels:
  • Upside resistance: The first target is $0.27, which has 8% upside potential from the current price. This is also the first level to test the effectiveness of the breakthrough.; If it can decisively stand firm at $0.27, the next step will be to hit the resistance zone of $0.31, corresponding to a 24% increase.
  • Downside support: The most critical support level is $0.22, which coincides with the 50-day moving average. Once it falls below, it means that the short-term bullish structure may loosen, ushering in the first test of buyer confidence.; If $0.22 fails, the next support will be seen at $0.20, which will bring DOGE closer to the 200-day moving average, which may trigger more selling.
  • Pivot point: $0.25 itself is a short-term decision-making point - if it stands firm, the bullish pattern will continue; if it falls below, it will approach $0.24 (near the 50-day moving average), and you need to be alert to the risk of further corrections.

Market sentiment: No fundamental interference, waiting for breakthrough signal


DOGE has not been directly affected by major news events over the past week, with price action largely dominated by technicals and overall crypto market sentiment. This state of “no news interference” makes technical signals more valuable for reference.

The current neutral RSI is superimposed on the sideways pattern, indicating that the market is in a "waiting period" - either waiting for the technical side to break through the resistance of $0.27, or waiting for the support to fall below $0.22. Before that, most investors choose to wait and see to avoid blind entry.

Trading Perspective: Clear Risk and Return, Focus on Key Failure Points


For traders, the current DOGE settings provide clear operating logic:
  • Steady strategy: Establish a long position above $0.25, target the resistance level of $0.27, set the stop loss below $0.22, the risk-reward ratio is about 2:1, and the profit-loss ratio is reasonable.
  • Aggressive strategy: wait for the price to clearly break through $0.27 before entering the market, with a target of $0.31, and the stop loss is also set at $0.22 to avoid the risk of chasing higher.
  • Short-term opportunities: The narrow range of US$0.24-0.26 is suitable for short-term scalping trading, but it should be noted that once the range is exceeded, a larger trend may be triggered, and positions need to be adjusted in time.
  • Key failure point: If the daily closing price of DOGE is lower than the 50-day moving average (about $0.24), the short-term bullish structure will fail, which may trigger a deep correction to the 200-day moving average, requiring a decisive exit from the market for hedging.

Bottom line: $0.25 is key, a break or break sets the trend


Overall, DOGE maintains technical stability at $0.25 - the moving average support is effective, the volume has not shrunk, and the bullish momentum has initially appeared. There are only two core concerns: either breaking through $0.27 to open up the upside, or falling below $0.22 and entering a callback channel.

If you want to grasp the follow-up trend of DOGE, you only need to focus on monitoring the breakthroughs of these two key price levels without being disturbed by short-term narrow range fluctuations.


精彩评论0
我有话说......
TA还没有介绍自己。