
68077
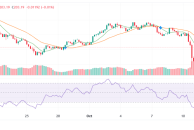
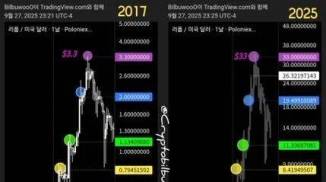
Bitcoin prices have moved away from a multi-year trendline after hitting a new all-time high on Monday. It's down $5,500 since its peak, but the decline is still small. Are more gains to come? Or are Bitcoin bulls ready to push BTC higher into price discovery? Further declines, or a return to the highs from here?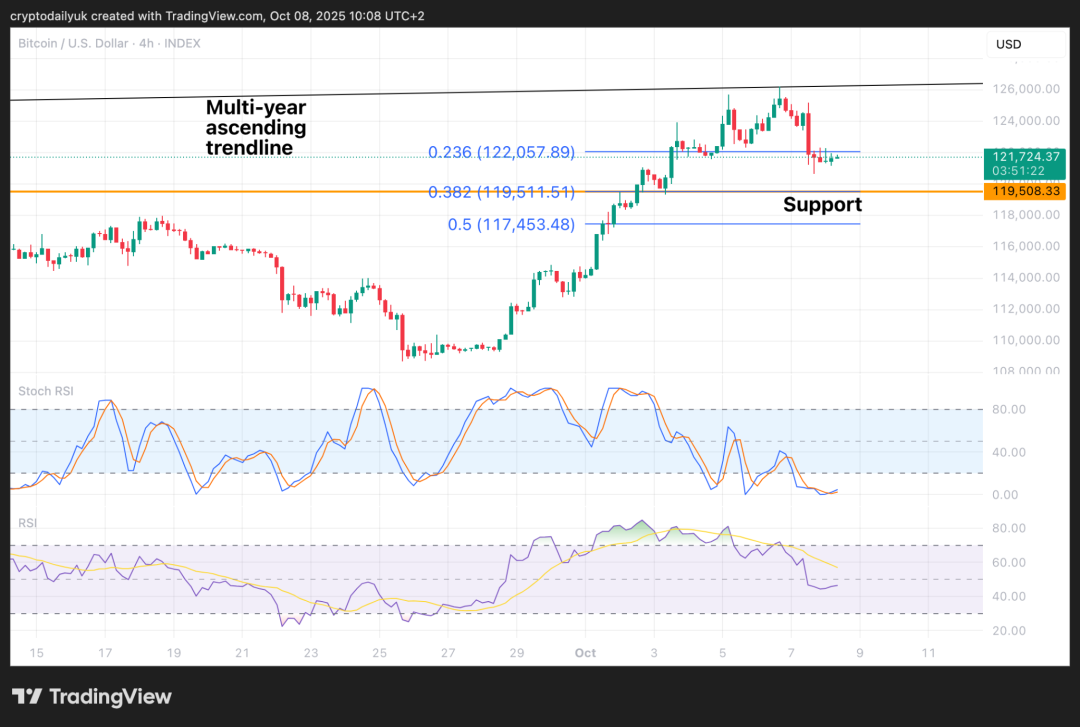 BTC 4 hour time frame Shows that this has been a very shallow decline so far. According to the Fibonacci extension lines (blue), the price has just fallen below the 0.236 Fibonacci level, which is the first Fibonacci extension line. If the price moves back to the top from here, there will be extremely bullish potential. That being said, deeper reversals are healthier and generally lead to more sustained upward price action. Therefore, if the price continues to decline, at least to the 0.382 Fib level (which coincides with good support), or even to the 0.5 Fib level, then the next swing high may contain even more power and momentum. Still, price action is what it is and if it goes up from here, so be it. The Stochastic RSI indicator is showing a rise from now on, and the RSI at the bottom of the chart may be about to start rising. These all suggest that this may be a bottom, and $BTC price A move back toward the multi-year trendline is possible, with new all-time highs on the horizon. Inverted head and shoulders pattern continues to form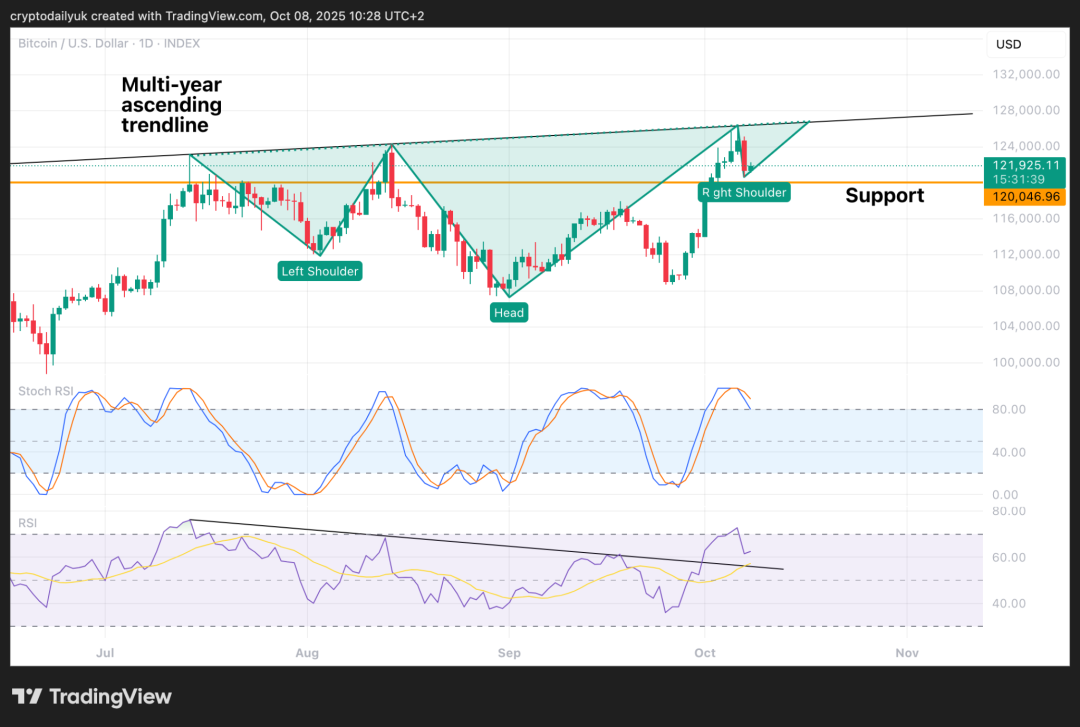 As in Tuesday's article as first proposed , an inverted head and shoulders pattern may be forming below the multi-year uptrend line. The right shoulder may have retraced far enough, or the price may fall further, even to the $120,000 horizontal support. The RSI indicator line at the bottom of the chart remains above the downtrend line. If the RSI indicator moves further downwards, it could mean a slight decline in price to hit horizontal support. Even so, even if price moves sideways and higher from here, it would be enough to form the right shoulder. As mentioned in yesterday's article, this measured move will allow $BTC price to around $145,000. Is the eight-year trendline about to be broken?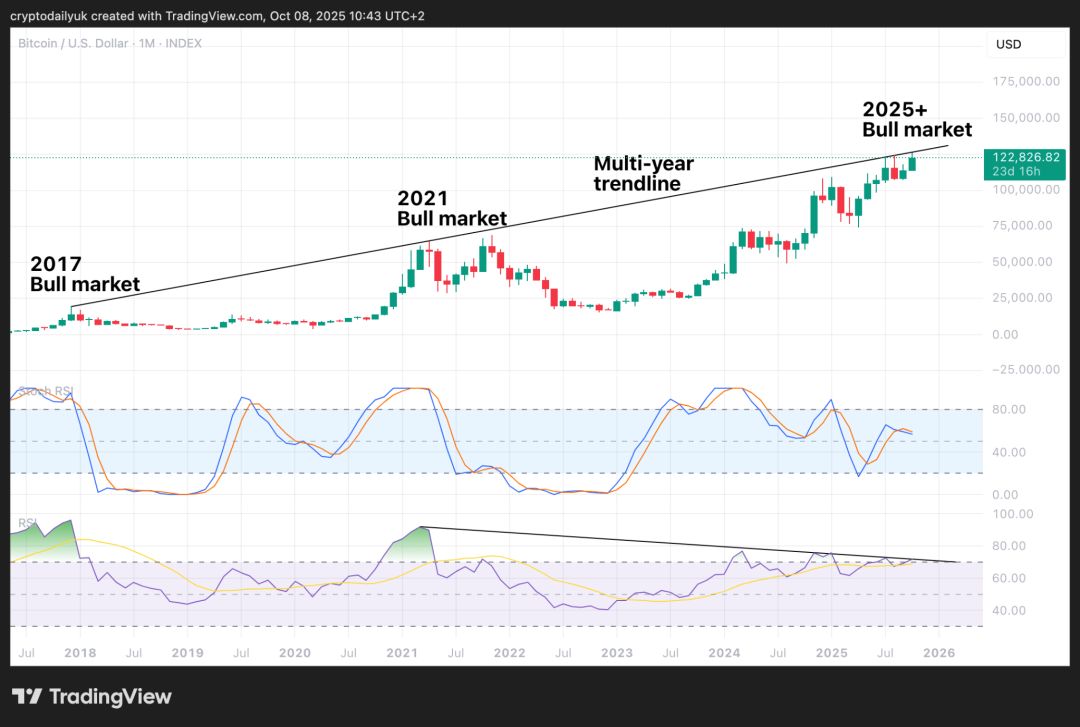 The monthly time frame provides a true birds-eye view of the multi-year trendline that began at the top of the 2017 bull market, was hit at the first top of the 2021 bull market, and has been tested three times in this bull market.Many indicators suggest that the current bull market is far from peaking, and perhaps this 8-year-old trendline will finally be broken, and when this long-term barrier is broken, the ensuing upward price momentum could be significant. Both the Stochastic RSI indicator and the RSI indicator on this high time frame are showing bearish divergence. First, the Stochastic RSI indicator needs to move higher again as it did on the weekly and two-week time frames. Secondly, the RSI indicator line needs to break above the downtrend line, and the RSI indicator line is currently above the downtrend line. If these two events occur at the same time, it is likely to be related to $BTC price The breakout of the 8-year trend line occurred simultaneously. Stunning price levels may follow. If you want to seize the current crypto market, it is definitely too late to learn and sell now. It is best to have someone who can help you get started quickly. Scan the QR code below to join the follow-up learning group! ! ! (If the QR code below cannot be added, please go to the official account to get the latest QR code)  [Disclaimer] There are risks in the market, so investment needs to be cautious. This article does not constitute investment advice, and users should consider whether any opinions, views or conclusions contained in this article are appropriate for their particular circumstances. Invest accordingly and do so at your own risk.  Keep up with the strategy in real time, come on! ! ! |

|

|

|

|

|
XRP skyrocketed by 1500%! The coming of the breakthrough str

Morning Post|Bitcoin plummeted, more than 160,000 people liq

BNB price surges 600% from bear market lows, next target is
SOL signals bullish breakout, golden cross forms ahead of ET

Bitcoin prospect analysis: The future path under opportuniti

Sun Yuchen responded to the rumored report of being "under b

sol intraday observation: Why do I insist on being long?

Good news for Ripple XRP!! Project development continues
2025-10-19
违法和不良信息举报电话:010-6688xxxx | 举报邮箱:jubao@huoxing.com | 网上有害信息举报
xxx网络有限公司 | 粤公网安备 46902302000xxx号 | ©2021 Discuz Team. Powered by Discuz!
 XRP
XRP